The Genera Debugger and Display Debugger
Genera has one interactive debugging engine with two principal presentations. The standard Debugger is a Command Processor loop on the error's usable interactive stream. It reads full English commands, accelerated keystrokes, or Lisp forms evaluated in the selected stack frame. The Display Debugger lays the same suspended condition, frames, proceed options, source or disassembly, arguments, locals, inspected objects, and interactor into a Dynamic Windows program frame.
The Display Debugger is therefore not a second condition system, a copied VM snapshot, or a standalone activity. The licensed source declares it nonselectable, allocates it as a temporary reusable resource, shadows the activity being debugged, and runs the ordinary Debugger command loop inside that frame. Its buttons, panes, presentations, and incremental redisplay are a structured view over live suspended execution.
The MIT predecessors are documented in The MIT CADR Error Handler and Window Debugger. The path used when normal streams or windows are unsafe is documented in Emergency Break and the cold-load stream.
Evidence and rights boundary
The user-facing manual is the publicly readable Symbolics Program Development Utilities manual for Genera 8. It describes the standard Debugger in depth and contains a printed alphabetical summary of its commands. It mentions and enters the Display Debugger, but does not supply a comparable pane-and-gesture reference. That missing visible behavior was reconstructed from the licensed Genera 8.5 source and then checked in the user's licensed world.
No licensed source or help payload is reproduced here. The following table records only filenames, byte counts, hashes, and original analysis sufficient to identify the local evidence.
| Local licensed source | Bytes | SHA-256 | Evidence used |
|---|---|---|---|
debugger/defs.lisp.~107~ |
16,053 | 849db8c65d75f1baa8e5e377e8d4e2eb82400cb14bc7c13c3672757345087e97 |
state, recursive levels, thresholds |
debugger/debugger.lisp.~784~ |
99,026 | 0f12aed40337a76298f42ba16fe3e23723ac005e34a63927c0dbff8b6c91e600 |
stream selection, invocation, command loop, help |
debugger/commands.lisp.~19~ |
91,999 | 4fa991a004df4cd7c0976f2253b9be8fcb334cb2f3c3b5bffaa80735da1988ec |
frame, code, transfer, trap, and evaluation commands |
debugger/display-debugger.lisp.~38~ |
45,535 | c6802ce33704f5495ba255949034b1a600aa79c21c32876fde835665930177f2 |
frame layout, buttons, gestures, menus, redisplay |
debugger/debugger-help.lisp.~34~ |
15,121 | 106c8f379e8cb9fecc75c79d53e639eda6719c45873f87d5bdc90aeb1d48f43f |
in-system standard Debugger help |
debugger/lisp-support.lisp.~44~ |
38,248 | 19da8e95088f19d58af15b58fb28bbd4127da1034d1501c2b720b21e538a8e99 |
Lisp frame and lexical-environment support |
debugger/analyze.lisp.~16~ |
20,375 | 75dc075191ccb51a039717c67a82ad504adee1f63542fc01a057d11db2af4cb3 |
frame analysis |
debugger/stepper.lisp.~7~ |
35,960 | 6e7bbdb140bcee4f8696457699d2b3b70fe67d0907d4fbab4259e68a87d1bc90 |
stepping machinery |
debugger/imonitor.lisp.~5~ |
75,854 | 19663258623c7010a9bf2a9bf11abd9899de1406e0775ad1d891aba606d68c9d |
monitored-location implementation |
cp/debug-commands.lisp.~23~ |
37,591 | a4ee47f2e64834cfb3a8a996b0fe505e9edf514191d7ef4effa7e7521ff32b67 |
global breakpoint and source commands |
cp/comtab.lisp.~103~ |
36,295 | f60724c8e2526950000f090f2dae4745b3394079713b3601606be865c23b98e1 |
command-table inheritance and Standard Arguments |
cp/read-accelerated-command.lisp.~142~ |
37,639 | 8107cf4e993068344e624ec924c8d0cf0327158a927c1962666d22eb81494388 |
prefix, Help, error and numeric-argument semantics |
The downloaded reference PDF was 2,292,247 bytes with SHA-256 2c6e23e4a0f969cb7962b71f0ed0eb390b47e394195f6ed9e7a862ba33914d6f. It was verified through 2026-07-19. The purchased archive, world, extracted source, and raw screenshots remain untracked.
From condition to debugger
The condition system decides whether the Debugger is needed. Handlers see a condition object; if none handles it, the debugger receives that object along with the stack and the available restart/proceed machinery. Proceed choices are assembled dynamically from the condition, handlers, and special commands. That is why a Debugger opening prints a set of choices whose meanings vary by error rather than relying on one fixed restart menu.
The Debugger then:
- invokes the one-shot
*debugger-hook*, rebinding it to prevent accidental recursion through the same hook; - chooses
*debug-io-override*if present, otherwise the failing program'sdebug-io, and tests whether the resulting stream and window are usable; - falls back to the cold-load stream for noninteractive, recursive, or damaged window cases;
- selects the innermost and current language-specific stack frames;
- constructs condition-specific proceed accelerators and special commands;
- reads either accelerated commands, full CP commands, or forms;
- evaluates forms in the current frame's lexical environment by default and preserves all returned values; and
- ends only when a proceed/restart, return, reinvocation, throw, abort, or outer recovery operation transfers control.
Before the full command loop, selected conditions can be offered through a small temporary proceed menu. The source excludes unsuitable cases such as the cold-load stream, remote terminals, break conditions, and recursive debugging. This is a convenience path over the same condition choices, not a separate debugger.
Recursive-failure ladder
The source defines explicit debugger-depth thresholds. At depth 15 it forces the cold-load stream; at 20 it requests a break; at 25 it invokes Emergency Break; and at 30 it halts. These numbers are source-visible safety policy, not normal user workflow. They show that Genera treats failure of the debugger itself as a staged degradation problem rather than assuming Dynamic Windows is always available.
Entry and exit paths
| Path | Meaning |
|---|---|
| Unhandled condition | normal automatic entry after handlers decline the condition |
m-SUSPEND |
enter while a program is waiting for terminal input |
c-m-SUSPEND |
force immediate entry in a running program |
break or zl:dbg |
deliberate programmatic debugging entry |
| Abort or Control-Z | abort the failing action to the prior command level/debugger, subject to the active abort choice |
| Resume | choose the default proceed/restart action if one exists |
:Display Debugger or Control-Meta-W |
replace the ordinary stream presentation with the Display Debugger |
| End in the Display Debugger | return to the ordinary Debugger while retaining the error context |
| Switch windows | temporarily select the shadowed failing activity; Function-S returns to the Display Debugger |
Suspend, Abort, Resume, End, and Function are Symbolics keyboard character names. Host X11 keysyms in the museum harness are a separate layer and are reported with the runtime evidence.
The standard Debugger interaction model
The standard prompt is a right arrow. Colon or Meta-X starts a full CP command such as :Show Backtrace; an accelerator can invoke the same command directly; a Lisp form is evaluated in the selected frame. A numeric prefix on colon or Meta-X is an accelerator error because that entry accepts no argument. Output is presentation-sensitive, so stack frames, functions, values, and source objects can carry pointer gestures appropriate to their types.
Evaluation normally inherits the current frame's lexical environment. The :Use Dynamic Environment / :Use Lexical Environment toggle changes that choice. The Debugger protects its own streams, history variables, hooks, and condition machinery from the borrowed environment. Recursive errors from a typed form create another debugger level rather than silently corrupting the first.
The manual says Control-Help lists all commands and accelerators; plain Help is a shorter introduction. Source further routes Help through a separate Dynamic Windows help display when the Display Debugger is active.
Complete printed Debugger command inventory
This table covers every command in the Genera 8 printed “Summary of Debugger Commands.” Accelerators are stated where the summary gives one. Commands without a fixed key remain available by their colon-prefixed CP names and, in some contexts, presentations or Display Debugger menus.
| Full command | Accelerator(s) | Purpose |
|---|---|---|
:Abort |
Abort, Control-Z | abandon the failing action to the applicable outer handler/command loop |
:Analyze Frame |
Control-Meta-Z | identify the erroneous frame and associated source |
:Bottom Of Stack |
Meta-> |
select the least-recent frame |
:Clear All Breakpoints |
— | remove all breakpoints from a chosen compiled function |
:Clear Breakpoint |
— | remove one compiled-code breakpoint |
:Clear Trap On Call |
Control-X Control-C | clear the selected call trap |
:Clear Trap On Exit |
Control-X Control-E | clear selected or all exit traps |
:Describe Last |
Control-Meta-D | describe the most recently displayed value and retain it in * |
:Disable Aborts |
— | suppress the Debugger Abort command |
:Disable Condition Tracing |
Control-X T | stop tracing signalled conditions |
:Edit Function |
Control-E | visit current or selected function in Zmacs |
:Enable Aborts |
— | restore the Abort command |
:Enable Condition Tracing |
Control-X T | trace conditions to debug handler behavior |
:Find Frame |
Control-S | search function names and select a matching frame |
:Help |
Control-Help | list commands, descriptions, and accelerators |
:Mail Bug Report |
Control-M | open mail with system identity, error, and backtrace |
:Monitor Variable |
— | trap on selected accesses to a special variable/location |
:Next Frame |
Line, Control-N, Meta-N, Control-Meta-N | move toward less-recent callers with differing detail/visibility modes |
:Previous Frame |
Return, Control-P, Meta-P, Control-Meta-P, Control-Meta-U | move toward more-recent callees or normalize to an interesting frame |
:Proceed |
Resume | perform the default available proceed/restart action |
:Proceed Trap On Call |
Control-X Meta-C | resume and trap at the next function call |
:Reinvoke |
Control-Meta-R | retry the function represented by the current frame |
:Restart Trap On Call |
Control-X Control-Meta-C | reinvoke and trap at the next call |
:Return |
Control-R | make the selected frame return requested value(s) |
:Set Breakpoint |
— | replace a compiled instruction with a Debugger breakpoint |
:Set Current Frame |
mouse selection | make a presented stack frame current |
:Set Stack Size |
— | set Control, Binding, or Data stack capacity |
:Set Trap On Call |
Control-X C | trap at the next call from the current frame |
:Set Trap On Exit |
Control-X E | trap when current or selected outer frames exit |
:Show Arglist |
manual: Control-X Control-A | display the current function's lambda-list; see discrepancy below |
:Show Argument |
Control-Meta-A | display one or all arguments |
:Show Backtrace |
Control-B, Meta-B, Control-Meta-B | brief, detailed, or full stack views |
:Show Bindings |
Control-X B | display special bindings for one or more frames |
:Show Breakpoints |
— | list compiled-code breakpoints |
:Show Catch Blocks |
— | show active catch/unwind blocks |
:Show Compiled Code |
— | disassemble current or selected function |
:Show Condition Handlers |
— | show handlers active around selected frames |
:Show Frame |
Refresh, Control-L, Meta-L | redisplay the current frame at selected detail |
:Show Function |
Control-Meta-F | display the current function object/name |
:Show Instruction |
Control-Meta-I | display trapped or next instruction |
:Show Lexical Environment |
— | display bindings inherited from lexical ancestors |
:Show Local |
Control-Meta-L | display one or all locals |
:Show Monitored Locations |
— | list active location monitors |
:Show Proceed Options |
— | redisplay current proceed and restart choices |
:Show Rest Argument |
— | display and format the current &rest argument |
:Show Source Code |
Control-X Control-D | display available source for a function |
:Show Special |
— | display a special variable in the selected frame's environment |
:Show Stack |
— | show local and temporary stack slots |
:Show Standard Value Warnings |
— | explain debugger-relevant nonstandard special bindings |
:Show Value |
Control-Meta-V | display one or all outgoing return values |
:Single Step |
Control-Shift-S | execute one instruction at a time while stepping over calls |
:Symeval In Last Instance |
Control-X Control-I | interpret a symbol as an instance variable in the last shown instance |
:Throw |
Control-T | evaluate a tag and value, then perform a nonlocal throw |
:Top Of Stack |
Meta-< |
select the error/most-recent frame |
:Unmonitor Variable |
— | remove one or all special-variable monitors |
:Use Dynamic Environment |
Control-X I | evaluate subsequent forms outside the selected lexical environment |
:Use Lexical Environment |
Control-X I | restore selected-frame lexical evaluation |
:Display Debugger |
Control-Meta-W | enter the pane-oriented interface |
Source-visible additions and one manual discrepancy
The Genera 8.5 command source establishes several effective accelerators or commands that the printed alphabetical summary does not enumerate:
| Source-visible control | Meaning |
|---|---|
| Meta-Shift-N / Meta-Shift-P | move next/previous while explicitly including invisible frames |
| Control-Meta-Space | exchange current frame with the frame PDL |
| Control-Shift-B / Meta-Shift-B | brief or invisible-frame backtrace variants |
| Control-Shift-E | explicitly read and evaluate a form in the debugger |
| Control-X Control-A | show all argument values |
| Control-X Control-L | show all local values |
| Control-X Control-R | show the &rest argument |
| Control-X D | show compiled code |
| End | leave the Display Debugger for the ordinary error context |
Control-Space is an argument-class-sensitive tree rather than a generic toggle:
Control-Space
├─ no prefix -> push current frame
├─ modified numeric 0 -> show frame PDL
├─ exactly Control-U -> pop and select
├─ exactly Control-U Control-U -> pop and discard
└─ every other prefix, including typed modified 4 -> beep
The source distinguishes the :control-u argument class and value, so modified 4 is not equivalent to Control-U. Control-Meta-Space accepts no prefix and exchanges with the top saved frame; it does not rotate.
The inherited numeric tree starts at four with repeatable Control-U, accepts Control-, Meta-, and Control-Meta-modified minus/digits for signed decimal, and the modified Infinity character for signed 2^40. Unmodified digits, minus and Infinity begin Lisp-form input. Prefix state survives entry into Control-X. Control-X Help lists applicable continuations without executing one; an unknown continuation beeps, clears accelerator input and reports the undefined sequence. The complete Control-X tree and per-leaf argument semantics are specified in the D04 recovery-path specification.
The source binds Show Arglist to Control-Shift-A, while Control-X Control-A invokes Show Argument with :all. The printed manual assigns Control-X Control-A to Show Arglist. This is retained as a manual/source discrepancy; without a direct runtime keystroke test, neither is silently rewritten into the other.
Some additional commands are presentation translators or Display Debugger-only menu targets—such as showing a pointed function's arguments, returning or reinvoking an arbitrary pointed frame, choosing source versus compiled code, and choosing ordinary versus invisible backtraces. They are visible in the relevant context but are not claimed to be members of the printed standard summary.
Debugger evaluation functions
The manual exposes functions specifically for forms evaluated in the Debugger:
| Function | Read behavior | Mutation behavior |
|---|---|---|
dbg:arg |
argument by name or number | (setf (dbg:arg ...) ...) changes the live frame slot |
dbg:loc |
local by name or number | its setf changes the live local slot |
dbg:fun |
current function object | its setf replaces the frame's function object |
dbg:val |
numbered outgoing value | its setf changes the value the frame will return |
dbg:monitor-location |
establish a locative monitor for reads, writes, binding tests, unbinding, or locating | changes monitoring state and causes future Debugger entry |
dbg:monitor-instance-variable |
monitor one instance slot | same selected access classes |
dbg:unmonitor-location |
identify a monitored locative | removes its monitor |
These APIs make the debugger an execution-control environment, not a passive viewer. Museum runtime checks avoid all mutation and monitoring operations.
Display Debugger architecture and layout
The frame has eight named pane specifications arranged as two columns:
| Left column | Right column |
|---|---|
| title | proceed options |
| four-by-four command buttons | source or compiled code |
| backtrace | arguments, locals, and specials |
| inspect history | — |
| interactor | — |
The title identifies the activity whose window is shadowed. Selecting a backtrace frame updates the shared current-frame state; the proceed, code, and argument panes are then incrementally redisplayed. The inspect history retains complex objects reached through presentations or description. When source is available, forms in the code pane are themselves presentations; otherwise the pane shows disassembly.
The interactor is the ordinary Debugger reader. Every normal Debugger keyboard command remains usable there. Display Debugger entry is restricted to the main console and rejected recursively. While the frame is active, its default policy disables Abort to reduce accidental loss of the suspended computation; the button path can still invoke the Debugger's applicable abort choice.
What changed from the MIT window debugger
| Aspect | MIT System 46/303 | Genera 8.5 |
|---|---|---|
| Error model | ETEs in System 46; condition flavors and resume handlers in System 303 | mature condition/restart substrate with language abstraction |
| Ordinary command language | primarily single-character dispatch | full CP commands plus accelerators and forms |
| Graphical frame | constrained window with one command menu and embedded Inspector | Dynamic Windows program frame with presentations, incremental redisplay, and sixteen multi-gesture buttons |
| Relationship to ordinary debugger | alternate window command loop over same stack | explicitly shares the ordinary command table/loop and shadows the failing activity |
| Proceed presentation | fixed Continue in System 46; condition menu on System 303 Proceed right gesture | dedicated proceed-options pane plus Proceed button |
| Source/code view | Inspector-backed stack-frame object/disassembly | language-sensitive source presentations with compiled-code fallback |
| Debug instrumentation | traps, breakpoints, stepping mature in System 303 | adds CP commands, condition tracing, memory monitors, frame analysis, and richer source transfer |
The strongest continuity is the live-frame model: in every generation, the UI looks at a suspended computation and can change it. The strongest interface change is that Genera turns that model into typed CP commands and Dynamic Windows presentations rather than one fixed character table and menu pane.
Findings not evident from the public manual
- The Display Debugger is declared nonselectable and has no process or Select key of its own. It temporarily shadows the failing activity.
- Its panes share the ordinary Debugger state and command loop; it is not a second debugging engine.
- Main-console-only and no-recursion checks are explicit at entry.
- The sixteen button labels hide twenty-nine distinct gestures before counting submenu entries.
- The source/compiled, ordinary/invisible backtrace, trap, breakpoint, and monitor choosers are separate command menus.
- End exits only the Display Debugger. This is the Genera counterpart of System 303's Exit Window EH, not an Abort.
- Arguments and locals in the pane are mutable through a Control-Meta-right presentation gesture.
- The source maintains per-pane redisplay ticks and cached displayed-code state.
- The standard manual's Show Arglist accelerator disagrees with the inspected source, as documented above.
- The recursive-failure thresholds form an explicit degradation ladder ending in a halt.
Runtime observation: Genera 8.5
The fresh debuggers-d12-genera-20260718 session booted the licensed Genera 8.5 world into Dynamic Lisp Listener 1. The listener evaluated the project-authored probe ,(error "Museum debugger probe D12"). The ordinary Debugger then displayed the exact error text, selected CP::COMMAND-LOOP-EVAL-FUNCTION, printed its arguments and defaulted environment, and constructed two condition-specific Super choices: return to the listener's Lisp top level, or restart the listener process. This directly confirms that the opening choices are derived from the live condition rather than one fixed menu.
Entering (+ 40 2) at the arrow selected the Debugger's Eval operation, printed 42, and advanced the visible frame display to SI::EVAL. No guest state was changed by the form. A later clean :Abort returned to Dynamic Lisp Listener 1 and printed the transfer back to its Lisp top level.
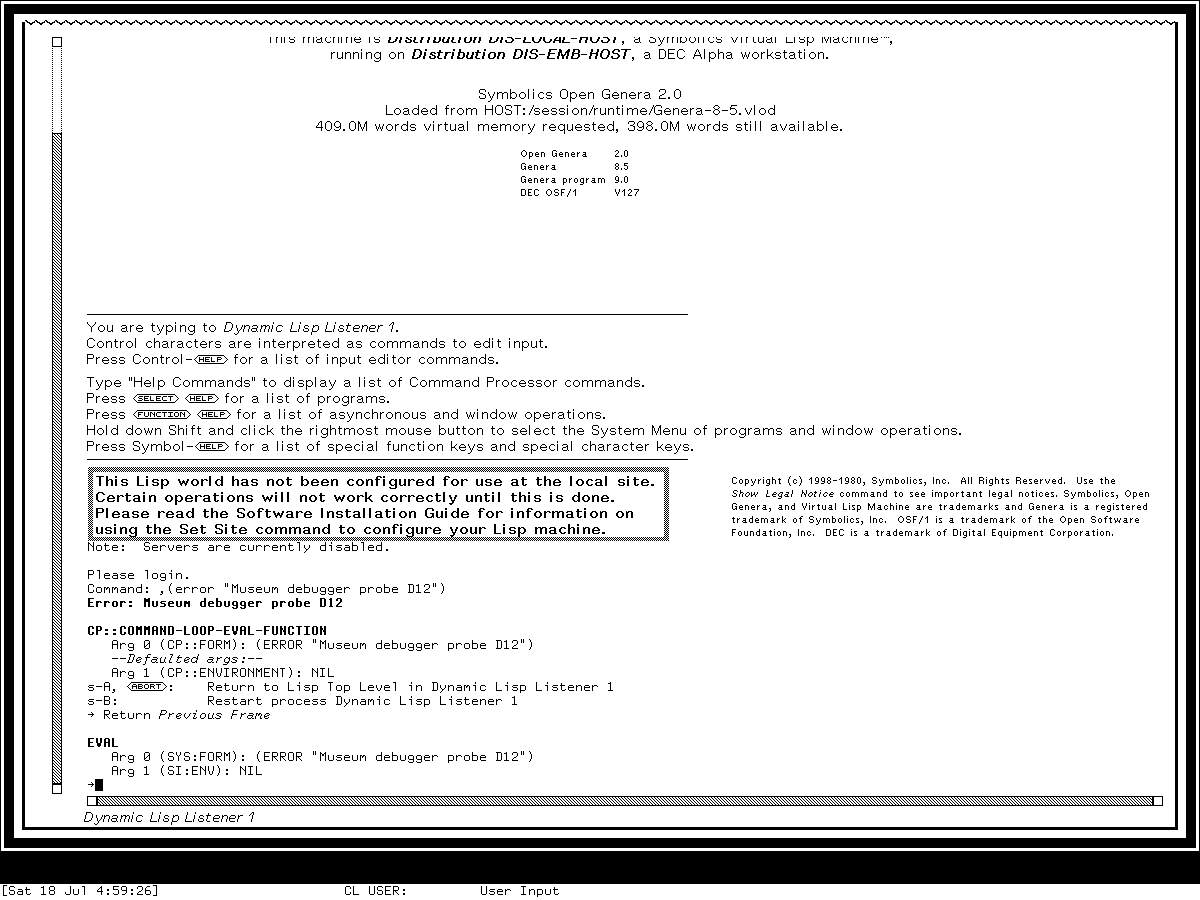
Runtime observation: this exact Genera 8.5 display records the ordinary Debugger before any proceed or mutation on 2026-07-18. The Dynamic Lisp Listener's top edge is visibly ragged while its side edges remain straight, a bounded runtime example of the viewport-continuation border. It is published as the minimum visual evidence for those visible claims and the Debugger's live condition choices and text-oriented frame view; Symbolics retains interests in the licensed historical software, and inclusion implies no endorsement.
Display Debugger entry caveat and live layout
The harness's attempted host Control-Meta-W translations did not produce a claimed guest accelerator event, so this run does not call that keystroke runtime-confirmed. A typed evaluation of (dbg::com-enter-display-debugger) did enter the pane-oriented frame, but it also demonstrated why evaluating a command implementation in the selected error frame is not equivalent to invoking the command through the Debugger command loop. The selected frame did not contain the Debugger loop's dynamic binding for DBG::*INSPECT-HISTORY-PANE-TICK*; redisplaying the history pane therefore signalled a nested unbound-variable condition. Source places that binding around the ordinary command loop, which accounts for the observed difference without treating the evaluated implementation call as a supported entry path.
Even in that bounded failure state, the live frame verified the source-derived layout: the title named Dynamic Lisp Listener 1; the complete four-by-four button matrix was visible; the proceed choices occupied the upper-right pane; the backtrace and history/interactor occupied the left; and disassembly plus arguments, locals, and specials occupied the right. The nested condition added temporary choices to supply or store a tick, retry, skip the history-pane redisplay, abort the Debugger command level, return to Lisp top level, or restart the listener. Pointer help identified the presented Skip redisplay of pane HISTORY choice; taking it returned control to the Display Debugger interactor. Clicking Exit then restored the ordinary Debugger while retaining the original synthetic error context. No proceed, frame mutation, return, reinvocation, monitor, breakpoint, or trap operation was performed.
This is an evidence-bounded result: the pane structure and Exit semantics are runtime-confirmed, while normal Control-Meta-W entry remains source/manual- established and needs a future verified host-to-Symbolics modifier mapping. The nested tick error is evidence about the deliberately evaluated internal entry function, not a claim that supported Display Debugger entry normally fails.
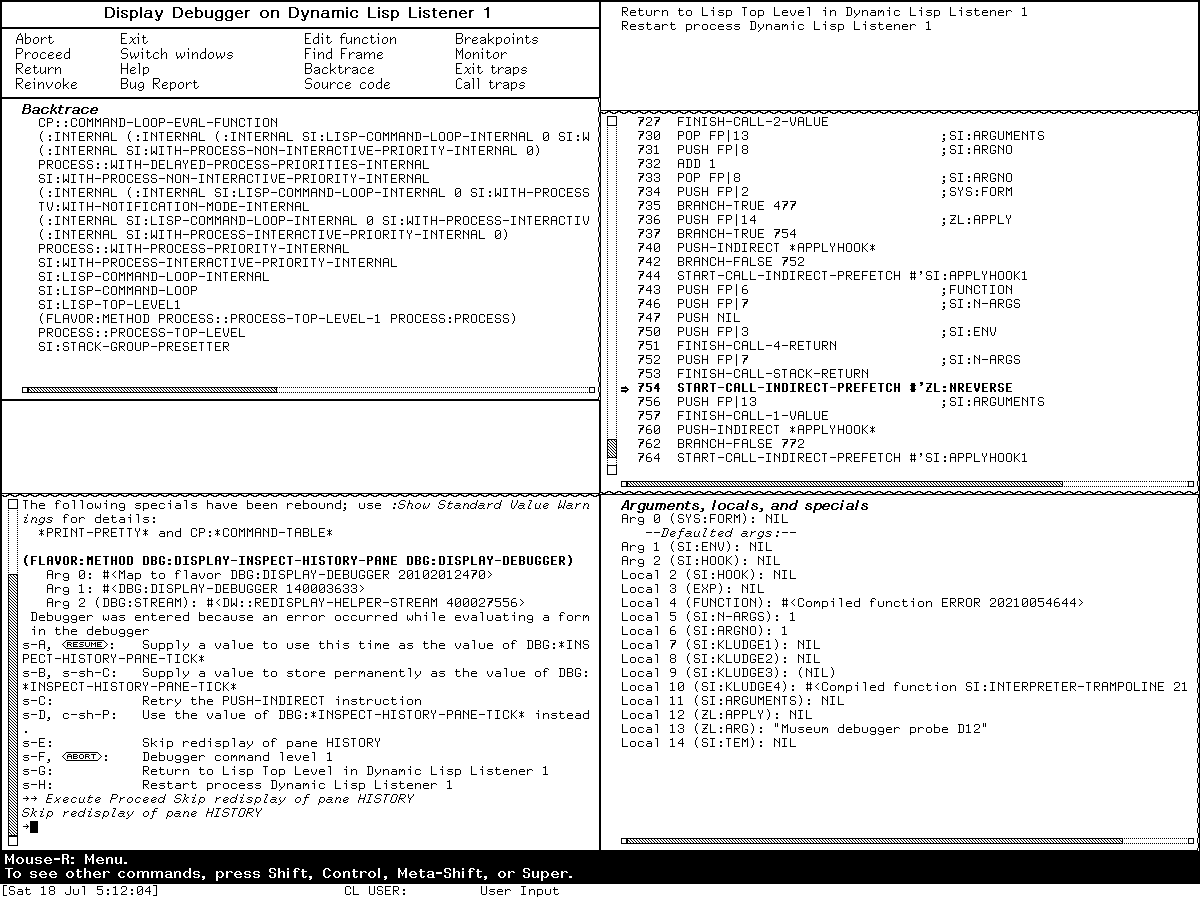
Runtime observation: this exact pane-oriented state on 2026-07-18 establishes the Display Debugger's visible organization and the retained synthetic error context after the explicitly documented internal-entry caveat. It is published for interface analysis rather than decoration; Symbolics retains interests in the licensed software, and inclusion implies no endorsement.
Capture selection and portable provenance
The ordinary-Debugger and Display-Debugger captures above passed an image- and use-specific review and were copied byte-for-byte into the curated Genera asset tree. These two monochrome functional displays are the minimum images needed to compare the distinct interfaces beside substantial source-, manual-, and runtime-grounded analysis. They expose no private user data, manual pages, artwork, or third-party media and are unlikely to substitute for the licensed system. All other captures remain ignored raw session evidence.
| State | PNG SHA-256 | Pixel SHA-256 |
|---|---|---|
ordinary Debugger; curated as debugger-dynamic-choices.png |
2b768105e7f32ded7bfc746669184d7e0d46fcc683d2c97217d94afbfe88044d |
770360dcb7b9b46f454e1314c58b7d3794ab1b0bb109dfa2aefe675d27a73134 |
side-effect-free evaluation and 42 |
06f9369abe03f376a3e15fc347a2565f7b3141e695c1bd40f944bb2a32e278fe |
2bdb0ef792a03a69e81602a5da22d3cfc1c2fd27cc7d11fd4db51321cd6e43b6 |
| Display Debugger with the nested tick condition | c3f7fb11f3c4f9b83542a7378d06bf1e06d58cb69b398e9f21689643bbe05a0a |
6cd88c7652f4e2f7333318bc6fdb2bff5b4005fedbe2a8152c4fab7fa112f9e2 |
Display Debugger after skipping history redisplay; curated as display-debugger-layout.png |
cf6f7a40fc8cf47317e386c85fc9055edb12d7971e9031d9d9877914a3ca94ba |
d8a52573ebd410c456cc2b2a0adcf22dbcb8bf736e1d1b5aef4f488fe01e770a |
| ordinary Debugger restored by Exit | 8e843c6fcb70d59f9c04267ca0cbcf640b3db0e60c87a12851e3e9928d7fcfd8 |
083fdcbb3094d5d2fee9f569b459c35a9749d1b19f731889973d318573a7f6a5 |
listener restored by :Abort |
d17c227bd7139662bba7b9b7c344509bc5e1843b9da288631a61c57a1591558a |
3269547bb61ec3e1ad6edc693ea71fa0525219d6b3ea9ed01d88a73bbdf34c08 |
Generation 2 ran from 2026-07-18 04:55:22 through 05:18:00 EDT on display :200; the selected window was XID 4194310, titled Genera on DIS-LOCAL-HOST, at 1200 by 900 pixels. The licensed world was 54,804,480 bytes with SHA-256 a8ee5e86cc7e322f7385af3e0cd579d7650d4dcfc3ce328acbf8b25515dd0672; the VLM and debugger hashes were respectively 9f5e18d5770f973879716182b6856ef5a8ee9d3b2bb907476ea0cf35986aa4c7 and 2db918cfe8f35f52c7ff4b7695b0ecd3bb85e41a3327ea5a94874edf05edb54a. The purchased archive was 206,213,430 bytes with SHA-256 89fb3e76b91d612834f565834dea950b603acf8f9dbacacdd0b1c3c284a2d36e.
The generation-scoped action record contains 80 linked intent/outcome entries and has SHA-256 c865f298f1710ffd67237ed52a6a7abd8fc72dba38e37a6b8387483e09b96386. It retains the unsuccessful key and command-entry probes as well as the successful synthetic error, evaluation, internal entry-function evaluation, presented skip choice, Display Debugger Exit, and final Abort. The same session also contains a separately scoped non-mutating Screen Editor menu capture; it is not evidence for this debugger article. The final run record has SHA-256 e83a9a7896b44b028d115f0da452b35f38d841bfeead1b805439814984688e03.
The sandbox had no default or external route and no guest-visible host file service. It exposed only the private writable runtime, exact X socket and helpers, and a read-only Guix store. Xvfb did not advertise MIT-SHM. Both exact guest X substitutions and the single local RFC 868 request/reply were observed; the responder exited zero. Toolchain provenance used Guix commit 230aa373f315f247852ee07dff34146e9b480aec, manifest SHA-256 3adae999bbe420182f22adc2499fcc82449a46eaf580a362de9c0e718fa6b37d, and Python 3.11.14.
Shutdown reached the prompt, sent yes, observed acceptance and cleanup progress, and then encountered the already documented Cold Load channel mutex stall. The bounded harness therefore forced the VLM after the confirmed stall; forced_stop and state_may_be_incomplete are true and orderly_vlm_host_shutdown is false. The base world hash was unchanged. The harness did not invoke Save World or create a process checkpoint; save_world_performed and guest_checkpoint_created remain unknown rather than being inferred from shutdown behavior.
Limits and open questions
- “Complete” for the standard Debugger means the printed Genera 8 command summary plus the explicitly enumerated source additions. Condition-specific proceed commands are dynamic by design and cannot be assigned one fixed list.
- No licensed source or decoded help text is tracked. Hashes identify the local evidence without redistributing it.
- The Display Debugger manual reference does not fully describe its layout or gestures; those claims depend on local source and the bounded runtime check.
- The debugger-specific translator base is enumerated, but inherited Dynamic Windows, language/type, loaded-world, and site overlays can extend effective Right menus. A live translator dump remains required before those menus can be called closed.
- The Show Arglist accelerator discrepancy requires a dedicated direct keystroke test before either mapping can be called runtime-confirmed.
- Mutation, monitoring, breakpoints, traps, returns, and reinvocations are source/manual-established but intentionally not exercised on the preserved world.
- The two selected captures are publication-reviewed for these documentary uses only. Remaining raw captures are not thereby publication-ready.
Sources
Public documentation link verified through 2026-07-19.
- Symbolics, Program Development Utilities, Genera 8, printed pages 182–245, especially the overview, command descriptions, printed summary, and Debugger evaluation functions.
- Licensed Genera 8.5 source files identified by filename, byte count, and hash in the evidence table above; inspected locally through 2026-07-19 and not redistributed.